The ability to make sense of the numbers, fractions, and percentages that appear in narrative texts and articles is an important skill in both numeracy and statistical literacy.
Participants in this 1.5-hour workshop will work on activities from a lesson that uses a student-written article from The Change Agent about the impact of climate change.
-
Teachers of ELA, science, social studies, and math at all levels. Accessible to teachers at all comfort levels of math.
This professional development activity/course is designed for:
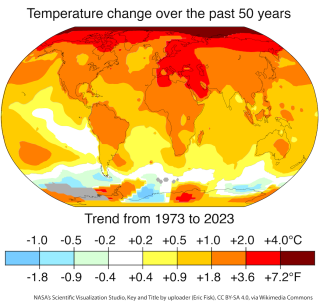
In this session, we will explore a lesson that uses colorful maps and statistics to help learners build the capacity to make sense of math in text through an investigation of data related to climate change and drought in northern Mexico. Participants will leave with access to the complete lesson plan and strategies for using other articles from The Change Agent in their own classes.
Please note: About a week before the event, registrants will receive a separate email from the SABES Math team at TERC (sherry_soares@terc.edu) with instructions on how to access the Zoom session.
- Consider the impacts of climate change on immigration
- Reason about fractions, percentages, and large numbers as they appear in text
- Reason about mathematical language as it appears in non-math contexts
- Reason about climate change using data and statistics
Upon completion of this professional development activity/course, you will be able to:
United States


