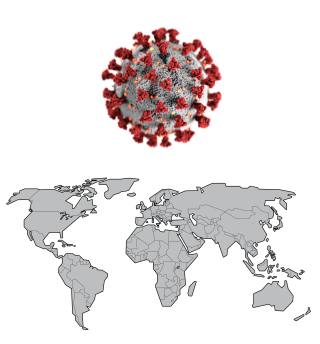
What is a pandemic? What makes it so scary? Understanding intuitively how a pandemic moves through a community will help students better understand why processes are put in place to ease the pandemic’s growth.
- ABE and ASE teachers and administrators at all levels of math ability and comfort
This professional development activity/course is designed for:
This virtual workshop will introduce several lessons designed for teaching ALL students about how pandemics spread and about exponential growth. You will participate in demonstrations of several activities from the lessons and explore exponential growth through simulations, drawing pictures, looking at data, and looking at graphs.
You will also receive some guidance on how to facilitate these lessons remotely with your students. These lessons can be taught remotely through video conferencing, but also will work with students who have little or no internet access. Participants will receive electronic copies of all the materials.
Please note: About one week before the event, registrants will receive a separate email from sherry_soares@terc.edu from the SABES Math Team at TERC with instructions on how to access the Zoom session.
- Describe exponential growth in simple terms
- Visualize exponential growth in several ways
- Explain the effect social distancing measures had on the spread of COVID-19
- Facilitate activities from the lessons with your students remotely
Upon completion of this professional development activity/course, you will be able to:


