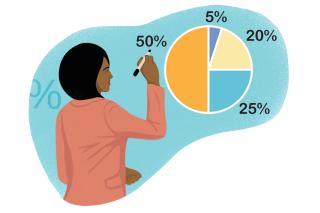
When students work with visual models that they can see, manipulate, or create, it opens visual pathways in the brain that provide added meaning to the area of the brain that processes abstract numbers. In this workshop, we will work with visual representations of percents and ratios and discuss how this enables students at multiple levels of math and language proficiency to better understand abstract mathematical concepts.
- ESOL and HSE teachers at all levels of math ability and comfort
This professional development activity/course is designed for:
In this interactive, 90-minute workshop, you will construct understanding of percents by deconstructing an image and creating your own visual model and math question. You will participate in a survey, and the data collected from the survey will be used to reason about ratios in a real-world context. You will be sketching, using virtual manipulatives, and sharing problem-solving strategies. You will leave with a toolkit of practical strategies for teaching ratios and percents using visual models and student-generated data. The resources available after the session can be used in a virtual or in-person classroom with both English learners and high school equivalency students.
Please note: Registrants will receive a separate email from Sherry Soares from the SABES Math team at TERC with instructions on how to access the Zoom session.
- Explain how visual mathematics can unlock learning potential
- Collect real-world data and use it to communicate math concepts
- Apply visual strategies to teach ratio and percent concepts
Upon completion of this professional development activity/course, you will be able to:
United States


